To design for visual comfort, you need to know how to measure light. The measurement and perception of light can be an in-depth topic, and effectively analyzing daylight requires being precise with the terms and metrics used.
|
Jump down to... - Basic Metrics
- Other Measures
|
Basic Metrics
 |
|
Being precise about metrics for lighting and daylighting is important. |
Luminous Flux and Intensity = Light Coming from a Source
Illuminance = Light Falling on a Surface
The amount of light falling on a surface is "illuminance", and is measured in lux (metric unit = lumen/m2) or foot-candles (English unit = lumen/ft2). 1 footcandle equals 10.8 lux. This is the measurement you’ll work with the most for optimizing visual comfort because building regulations and standards use illuminance to specify the minimum light levels for specific tasks and environments.
This value does not depend on the material properties of the surface being illuminated. However, since the amount of light the surface “sees” depends on how much is being reflected from other surfaces around it, it does depend on the color and reflectance of the surfaces that surround it.
The brightness of the sky is often given using illuminance values measured on an unobstructed horizontal plane. Some common illumination levels are in the table below, from The Engineering Toolbox:
| Condition | Illumination | |
| (ftcd) | (lux) | |
| Full Daylight | 1,000 | 10,752 |
| Overcast Day | 100 | 1,075 |
| Very Dark Day | 10 | 107 |
| Twilight | 1 | 10.8 |
| Deep Twilight | 0.1 | 1.08 |
| Full Moon | 0.01 | 0.108 |
| Quarter Moon | 0.001 | 0.0108 |
| Starlight | 0.0001 | 0.0011 |
Comfortable Illumination Levels
The values above represent the total illumination available from the sky. As a designer, your job is to make sure that the occupants of your building have the right level of light for their activity, and try to get as much of that light as possible from natural light. These levels are usually measured on a working surface in the building.
Areas can be too dim or too bright, and these levels depend on the task. The brightness required to make jewelry or assemble electronic components is far greater than the brightness required to safely walk to a room's exit. The following is a table of commonly recommended light levels for different activities. To design for the activities in your program, see local codes or green building certification standards.
|
Standard Maintained Illuminance (lux) |
Foot-candles |
Characteristics of Activity |
Representative Activity |
|
50 |
5 |
Interiors rarely used for visual tasks (no perception of detail) |
Cable tunnels, nighttime sidewalk, parking lots |
|
100 - 150 |
10-15 |
Interiors with minimal demand for visual acuity (limited perception of detail) |
Corridors, changing rooms, loading bay |
|
200 |
20 |
Interiors with low demand for visual acuity (some perception of detail) |
Foyers and entrances, dining rooms, warehouses, restrooms |
|
300 |
30 |
Interior with some demand for visual acuity (frequently occupied spaces) |
Libraries, sports and assembly halls, teaching spaces, lecture theaters |
|
500 |
50 |
Interior with moderate demand for visual acuity (some low contrast, color judgment tasks) |
Computer work, reading & writing, general offices, retail shops, kitchens |
|
750 |
75 |
Interior with demand for good visual acuity (good color judgment, inviting interior) |
Drawing offices, chain stores, general electronics work |
|
1000 |
100 |
Interior with demand for superior visual acuity (accurate color judgment & low contrast) |
Detailed electronics assembly, drafting, cabinet making, supermarkets |
|
1500 -2000+ |
150-200+ |
Interior with demand for maximum visual acuity (low contrast, optical aids & local lighting will be of advantage) |
Hand tailoring, precision assembly, detailed drafting, assembly of minute mechanisms |
Recommended illuminance levels for different tasks.
For more information on recommended levels from the Illuminating Engineering Society see here.
Measuring Illuminance in Software
With various available lighting analysis software, you can see the actual value of useful light falling on critical surfaces like desks, walls and walking surfaces. Depending on the levels of illuminance required for a particular use or activity, you can use these quantitative renderings to understand whether the space is useful or if the design needs more attention.
  |
| (Left) Illuminance rendering - Daylighting only. (Right) Illuminance rendering - Electric lighting only. |
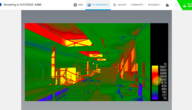
In daylighting analysis, you often want to map illumination over the space to see how light “falls-off” as you get farther from windows and other light sources. The images below show a graph of work surface illuminance levels charted over a sectional visual rendering. These graphics help to show whether work surfaces are achieving adequate lighting levels as wells as helping to visualize the contributing light sources.
 |
| Illuminance values plotted on a cross-section of the working surface within an office space, during the day and during the night. Image from Loisos + Ubbelohde. |
 |
|
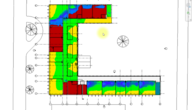
Illuminance values on the workplane of a classroom. |
Luminance = Light Reflected by a Surface
Luminance is the light reflected off of surfaces and measured in candelas per square meter (cd/m2), or Nits (in imperial units).
Luminance is what we perceive when looking at a scene, or when using a camera. The quality and intensity of the light that reaches our eye does depend on the material properties of the surfaces (color, reflectance, texture).
Luminance values are often used to study the visual quality of a space. Visual software renderings (i.e. 3ds Max) are based on this and can give designers a very good idea of how the space will look based on their choices of light sources and materials.
While luminance is really useful for understanding qualitative measures of the success of a design, it is not a good measure of light quantity. Because the human eye can adjust for a huge range of illumination levels over 3-4 orders of magnitude, from bright daylight in the 10’s of thousands of lux (1000’s of fc), to mere 10’s of lux (single-digit fc), a visual rendering of a bright and a not-so-bright space are difficult to measure. Can you tell by looking at the visual renderings that there is over 100 times more light intensity on the wall in the day image than in the night image?
  |
| (Left) Visual Rendering - Daytime. (Right) Visual Rendering - Nighttime. |
Luminance renderings are useful for understanding qualities like light distribution and glare, but not for understanding if the space has enough light for its intended use. Glare is determined by comparing the extremes of luminance values that an occupant’s eye will see from a given vantage point.
Measures Used in Daylighting Design
Based on these measures, lighting designers use some additional metrics like daylight factor and daylight autonomy to help them optimize and communicate the quantity and quality of daylight within a space. This is important because the availability of daylight can change a lot throughout the day based on sky conditions.
Daylight Factor
The actual illuminance levels in the space from daylighting can vary greatly due to the cloud cover and position of the sun. To deal with these highly variable sky conditions, some building codes and design briefs use daylight factors as the design criteria instead of illuminance on the working plane.
Daylight factors are expressed as the percentage of natural light falling on a work surface compared to that which would have fallen on a completely unobstructed horizontal surface under same sky conditions. The daylight factor is analyzed at a point, but these values are often averaged across an entire room or visualized on a grid.
A daylight factor of 5% on an internal surface means that it received 1/20th of the maximum available natural light.
 |
For reference, a room that has a DF of less than 2% is considered poorly lit. Rooms with DF between 2% and 5% are considered ideal for activities that commonly occur indoors. With daylight factors of more than 5%, it is important to take into account thermal requirements (see human thermal comfort) because large areas of glazing can result in heat loss during the winter and overheating in the summer.
Daylight factors are generally calculated using a standard overcast sky in order to represent a worst-case scenario to be designed for (see Sky Conditions, above). The distribution of light in an overcast sky dome is assumed to consist of uniform horizontal bands that get brighter at the top (or higher solar altitude). Due to this uniform sky, and the fact that the daylight factor is calculated as a percentage, the only parameters that affect daylight factors are the geometry of the room design and the materials it is made of. It won’t depend on building orientation or location.
Daylight Autonomy (DA) and Useful Daylight Illuminances (UDI)
Daylight Autonomy (DA) is the percentage of working hours when lighting needs are met by daylight alone. It is measured by comparing daylight illuminance on a workplane to the minimum requirement over time. This is a very popular metric and can tell you how often lights need to be on to meet specific illumination requirements.
Useful Daylight Illuminances (UDI) also measures a percentage of time that a space receives adequate daylight, but it also quantifies when the light levels are too high and too low. UDI is based on three standard bins (which broadly line-up with comfortable illumination levels cited above).
- Less than 100lux is insufficient daylight
- Between 100 lux and 2000 lux is useful daylight
- More than 2000 lux is too much daylight and can result in visual and thermal discomfort
 |
|
UDI measured at different workspaces within an office building. Image from Loisos + Ubbelohde. |