Temperature data can be represented in a variety ways. Fully utilizing temperature charts will help inform your design decisions and make sure you are considering all the data.
 |
| Tabular temperature data can be clearly represented in a variety of different charts. |
Monthly Design Temperatures
Of course, temperatures are not always consistent at the same time of day or year. Designs that always achieve occupant comfort must consider extreme circumstances as well as average conditions.
 |
|
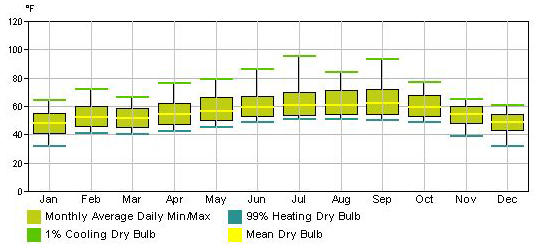
Monthly temperature design data graph |
The graph above shows not only monthly temperatures averaged from historical climate data, but also two levels of uncommon extremes.
The green boxes show the historical averages of monthly highest and lowest dry bulb temperatures; your site is virtually guaranteed to experience these temperatures in these months, so they must be designed for.
The extensions of the boxes show extreme temperatures only recorded 1% of the time in historical data. Your site is not likely to experience these often, but for a robust design, you should consider them.
 |
|
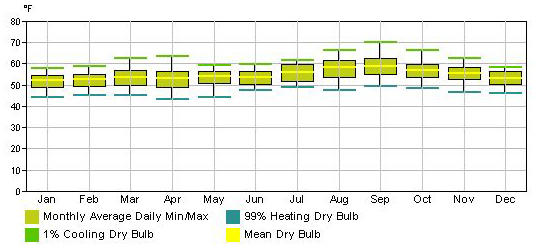
You can see that this site has significantly less variation than the previous graph. In April, a peak temperature of 64° F has occurred, but generally the temperature range will be between 48° and 57° F for the month. |
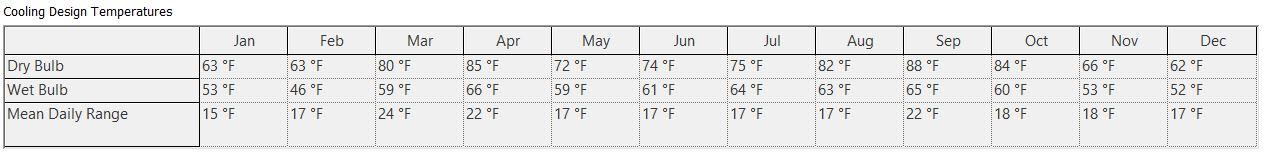
In Revit, the weather data of the building location is specified on the Weather tab of the Location Weather and Site dialog. The table below can provide similar information than a monthly temperature design data graph.
 |
|
This monthly cooling design temperatures table from Revit is from Columbus, OH. |
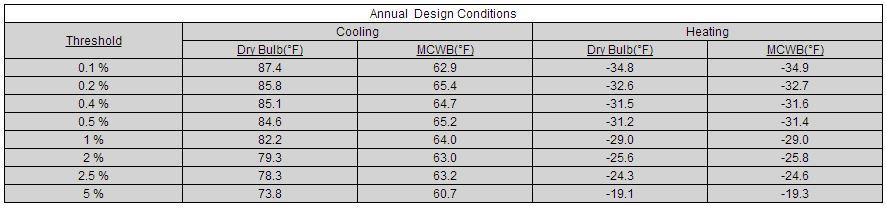
For the cooling loads calculation, a design day is derived for each of the 12 months of the year, with a maximum dry-bulb temperature corresponding to the 1% monthly percentile temperature for the location. This is the temperature that is exceeded on average, during that month, for 1% of the time.
For the heating loads calculation, the design outside dry-bulb temperature is set to the 99% annual percentile temperature for the location - the temperature that is exceeded on average over a period of years for 99% of the time.
Learn more about the Audubon Center here.
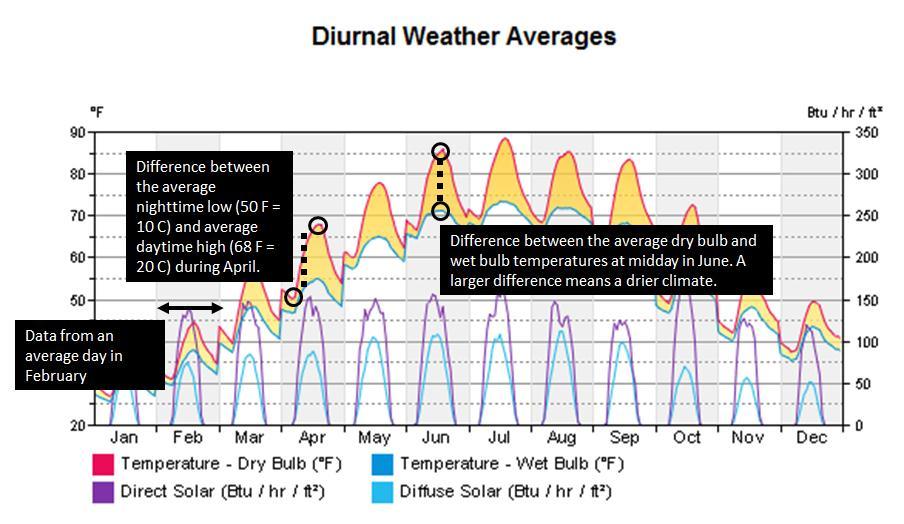
Diurnal Weather Averages
Diurnal temperature data shows daily cycles of temperature and radiation on the site. The data typically includes dry bulb temperature, wet bulb temperature, direct solar radiation, and diffuse solar radiation as a daily average for each month. From this data you can study the difference between dry bulb and wet bulb temperatures (relative humidity indicator), the difference between nighttime temperatures and daytime temperatures (known as the diurnal swing), and solar radiation patterns in addition to much more.
 |
|
This diurnal weather chart is from Nashville, TN. |
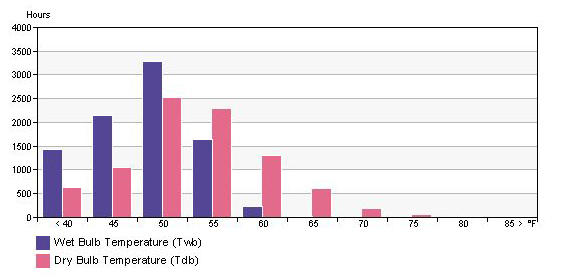
Annual Temperature Bins
For some sites, heating will dominate your design requirements most of the year; for other sites cooling will dominate. You can quickly see what temperatures are experienced at your site most often by looking at a histogram of temperature throughout the year. This is referred to as temperature bins.
 |
|
Annual temperature bins for a colder site, mostly requiring heating for comfort. The graph also displays the frequency of wet bulb and dry bulb temperatures, suggesting the climate does not have humid summers. |