climate
Software
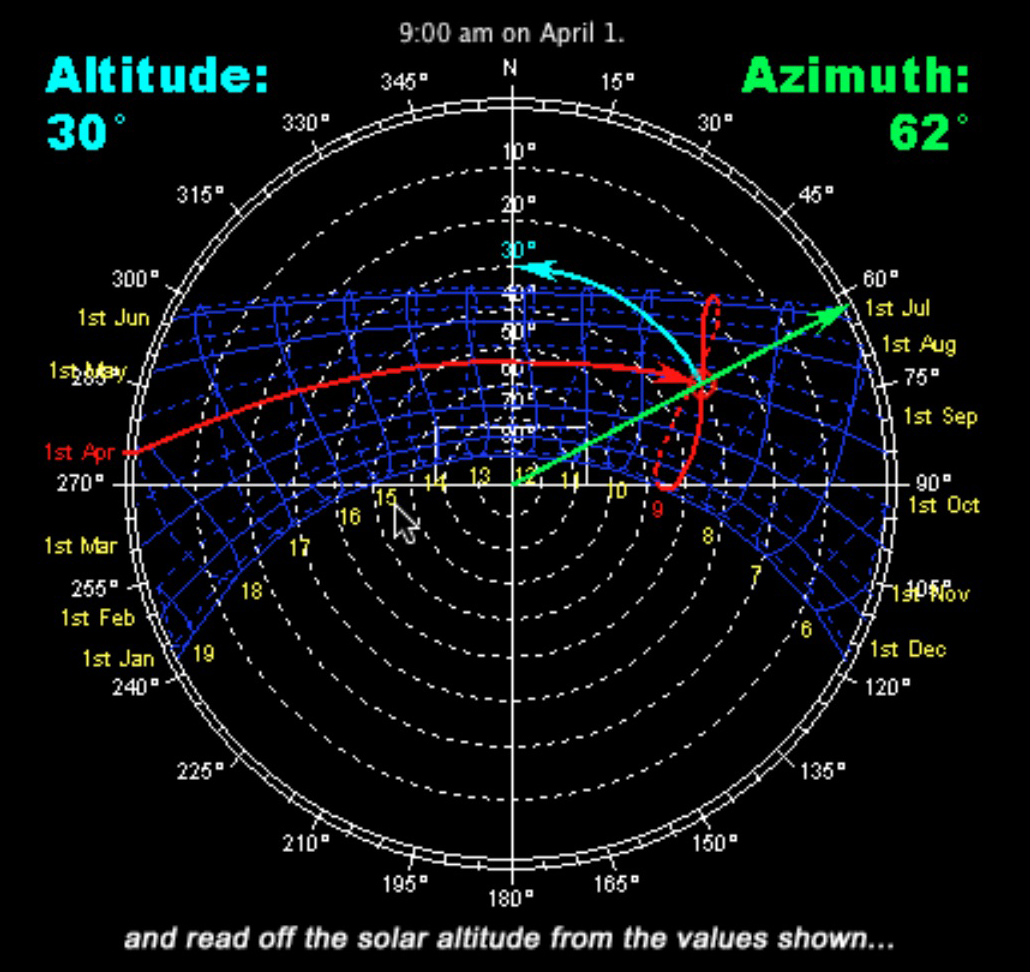
Sun path diagrams can tell you a lot about how the sun will impact your site and building throughout the year. Stereographic sun path diagrams can be used to read the solar azimuth and altitude for a given location.
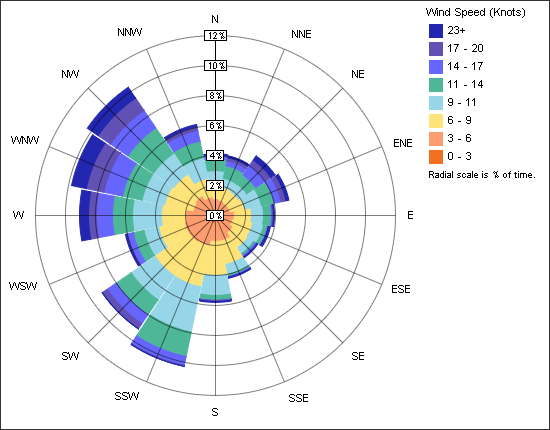
Wind rose diagrams are helpful for interpreting wind speed, frequency, and directionality. Use them to better inform your design decisions, but be aware of unique microclimates and site considerations that wind rose diagrams will not capture.
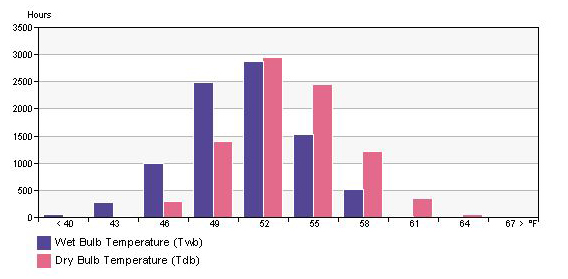
Temperature data can be visualized in a variety of ways. Use the information here to learn about the basic temperature charts you'll come acroos in Revit and some tips for getting the most out of them.
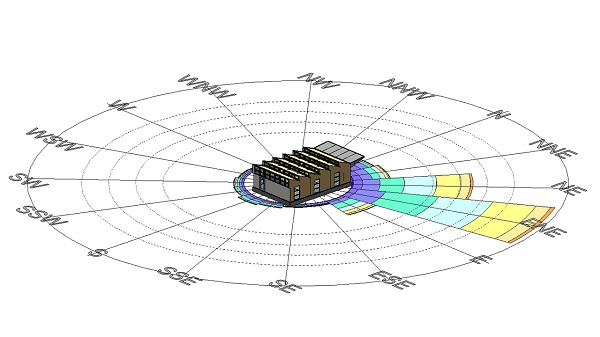
Wind provides natural ventilation and usually cools buildings and people because it accelerates the rate of heat transfer. Wind speed and direction change throughout the day and year, and are not as universally predictable.
As the sun moves, it can encounter sky conditions that can intensify it or obscure it. It is important to understand these metrics and account for them when designing high performance buildings.
Pages
Project Gallery Examples
A team of Italian students used analysis in Autodesk Vasari and Ecotect to determine a site placement and building layout for their nursery school design that took advantage solar insolation and protected the site from harsh winter winds.


