Humidity can be just as important as temperature for human comfort. Too much humidity can amplify the heat and make it feel “muggy”, while not enough humidity can be uncomfortably dry.
Warm air can hold more moisture than cold air can, but people don't perceive the absolute number of water molecules in the air (absolute humidity which is measured as density), they perceive relative humidity which is represented as a percentage of water vapor in the air.
 |
This graph of temperature bins compares wet bulb and dry bulb temperatures and helps understand humidity. The larger the difference between the dry and wet bulb temperatures, the drier the air and the lower the relative humidity is. You can see that Copenhagen is relatively humid because the temperature bins are roughly the same size and distribution for wet and dry bulb temperature. |
People generally consider 40% to 55% relative humidity to be comfortable. Below 40% will feel dry, above 55% will feel muggy and wet (unless the temperature is cold).
Humidity also affects what passive heating or cooling strategies will be most effective. For instance, evaporative cooling is much more effective in dry climates.
Controlling humidity is also an important function of active HVAC systems. There is a lot of latent heat in water, and de-humidifying the air requires cooling that water – which can require a lot of cooling energy. See more on heat energy flows in buildings.
Humidity can be determined by comparing wet bulb and dry bulb temperatures. At 100% humidity the air is completely saturated and the dry bulb and wet bulb temperatures will be the same. In all other scenarios, the wet bulb temperature will always be less than the dry bulb temperature due to evaporative cooling. The larger the difference between the dry and wet bulb temperatures, the drier the air and the lower the relative humidity is.
Humidity data is often displayed in a psychrometric chart. To learn how to read these charts, see the Psychrometrics page.
Like temperature, humidity varies throughout the day and year, and robust design requires designing for a range of humidities. You can graph humidity variation to help set your design requirements.
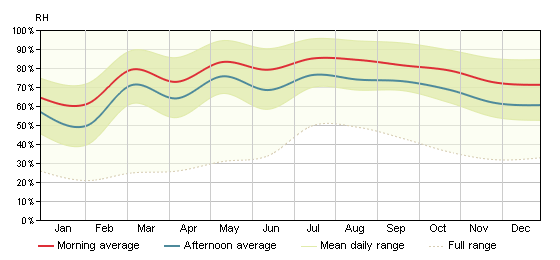 |
Humidity variation through a year at a site
|
The graph above shows average humidity in morning and evening from the historical record, with a thick colored band illustrating average daily range in humidity. The much wider translucent band bounded by dotted lines shows the full range of maximum and minimum humidity in the historical record. As with temperature variation, these extremes are not experienced often, but should be considered in the design.
Besides affecting cooling energy demands, humidity can also affect other sustainable design factors, such as the design of the building envelope. By understanding the humidity ratio of an air stream, we can identify at what temperature water will condensate (also known as the dew point). With this knowledge so we can prevent issues such as mold and decreased insulation performance with the proper placement of a vapor and water barriers in exterior walls and roofs. A good resource for comprehending the interactions between temperature, relative humidity, and dew point can be found at Dew Point Calculator.