Knowing how to measure energy use in buildings will help you set better energy efficiency goals. Energy Use Intensity (EUI) normalizes energy use by floor area and is useful for targets and benchmarks. But, when it comes to environmental impacts, you need to look upstream at “source energy.” Also, when it comes to energy efficiency measures, you need to know what end-uses take the most energy.
Energy Use Intensity
When comparing buildings, people not only talk about total energy demands, but also talk about "energy use intensity" (EUI). Energy intensiveness is simply energy demand per unit area of the building's floorplan, usually in square meters or square feet. This allows you to compare the energy demand of buildings that are different sizes, so you can see which performs better.
 |
|
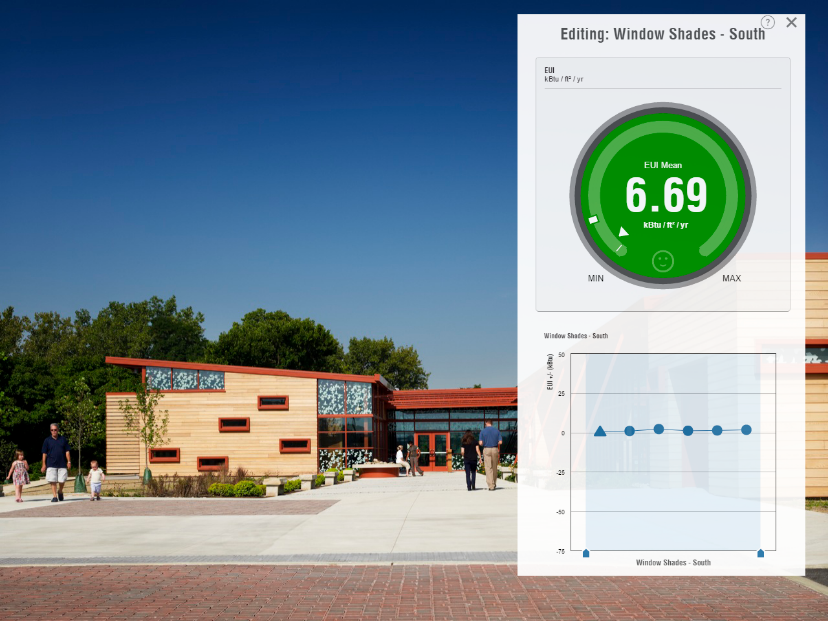
Autodesk’s Insight energy analysis tool report building performance in terms of EUI and Annual Cost. |
EUI is a particularly useful metric for setting energy use benchmarks and goals. The EUI usually varies quite a bit based on the building program, the climate, and the building size. The charts below, based on data from CBECS data from the United States, can give you an idea of the range of EUIs to expect based on these parameters.
 |
Energy Use Intensities based on building activity (building program).
Table available for download here. Data from the 2003 CBECS Survey Data for USA. |
 |
Energy Use Intensities based on building area.
Table available for download here. Data from the 2003 CBECS Survey Data for USA. |
The EPA’s Target Finder website is also a great resource for setting goals and benchmarks. Architecture 2030 has calculated similar targets using national medians.
Site Energy vs. Source Energy
 |
| The electricity that you use on your site, may use much more energy upstream. 1kWh of site electricity requires 3.3 kWh of source energy in the United States. Watch video on Energy Efficient Design. |
 |
| 1 kWh of site electricity from a solar panel on the building's roof is equal to 1 kWh of source energy, because the solar panel itself is the source. |
The energy intensity values in the tables above only consider the amount of electricity and fuel that are used on-site ("secondary" or "site" energy). They do not consider the fuel consumed to generate that heat or electricity. Many building codes and some tabulations of EUI attempt to capture the total impact of delivering energy to a building by defining the term "primary" or "source" energy which includes the fuel used to generate power on-site or at a power plant far away.
When measuring energy used to provide thermal or visual comfort, site energy is the most useful measurement. But when measuring total energy usage to determine environmental impacts, the source energy is the more accurate measurement.
Sometimes low on-site energy use actually causes more energy use upstream. For example, 2 kWh of natural gas burned on-site for heat might seem worse than 1 kWh of electricity used on-site to provide the same heating with a heat pump. However, 1 kWh of site electricity from the average US electrical grid is equal to 3.3 kWh of source energy, because of inefficiencies in power plants that burn fuel for electricity, and because of small losses in transmission lines. So in fact the 2 kWh of natural gas burned on site is better for heating. The table below provides the conversion factors assumed by the US Environmental Protection Agency for converting between site and source energy.
 |
| A table from the US EPA's EnergyStar Performance Ratings Methodology for Incorporating Source Energy Use. |
Energy End Uses
Commercial and residential buildings use energy differently. Commercial buildings are usually dominated by internal loads dominated (more people, lights, and equipment), and use more lighting than residential buildings. Residential buildings are usually dominated by envelope loads, and a larger percentage of their energy use is used for heating and cooling to meet those loads.
Sankey diagrams of energy use are great visualizations to show where the energy comes from and goes in a building. In a Sankey diagram, the width of the bar represents the quantity being measured and the chart flows “upstream to downstream” (usually following arrows).
In the Sankey diagrams shown below from the USDOE, energy sources are shown on the left (coal, natural gas) and energy end-uses are shown on the right (space heating, lighting, appliances). You can clearly see the difference between site energy and source energy in this diagram by the arrow that trails off at the top due to electric power plant transmission and distribution losses. These losses are one of the main reasons that electricity is much more expensive per unit of energy than natural gas or fuel oil.
 |
This Sankey diagram of residential building energy use in the United States shows that…
|
 |
This Sankey diagram of commercial building energy use in the United States shows that…
|