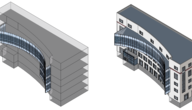
This project by Russian students demonstrates a rigorous and thoughtful design process that balances energy efficiency and aesthetic considerations. The team did whole building energy analysis and other performance studies to improve the massing, orientation, and constructions of a conceptual mixed use high-rise building.
Autodesk Software Used:
Project Goals & Design Process
This project was done for Autodesk’s global BIM competition in 2013. This project was the global winner of the sustainable design award within that competition.
The team’s goal was to create a visually appealing and energy efficient building. They chose to design a 40 storey mixed use building that included retail, office space, and a hotel.
The building is in Astana, Kazakhstan. This is a continental climate, meaning that the temperatures can get hot in the summer (30 C, 86 F) and very cold in the winter (-40 C, -40 F). Its Köppen−Geiger climate classification is Dfb (snow, fully humid, warm summer), bordering on BSk (arid, steppe, cold arid). Furthermore, it is in a continental steppe where the wind speeds can get very high (12.75 m/s – strong breeze on Beaufort scale). This is a challenging climate to design for.
The team used an iterative building performance analysis process. The analyses they conducted were: whole building energy analysis, solar radiation, and CFD for external airflow. Based on the results of these analyses, they tried to optimize the building’s massing, orientation, and glazing for energy use and aesthetics.
They performed four iterations with the following design goals:
- 1st iteration: Set a baseline
- 2nd iteration: Achieve same energy use, but make it more visually appealing
- 3rd iteration: Increase energy efficiency (target = 25% lower EUI)
- 4th iteration: Make it even more visually appealing, while maintaining reduced EUI
The Design & the Analysis Results
The team started by doing whole building energy analysis with conceptual mass models in Autodesk Vasari. In their analysis, they did not distinguish between the different building programs for this simulation (retail, office, hotel).
The software does not easily support simulations of separate building programs within a single mass. However, for these basic massing studies, assuming a unified program will likely result in valid conclusions how to reduce thermal loads. The team, and software reports, did not document which of these building types was used as the baseline of these simulations.
 |
| First iteration |
Iteration 1: Baseline
The first simulation was done on a basic 40 storey tower. Energy settings are explained in the graphic at right.
The energy use intensity (EUI) of the baseline building was found to be 140 kWh/m2/year.
The above chart shows the EUI of the baseline building, compared to data (from the USA) of average EUIs of similar building programs. (Chart Source)
Diving a bit deeper, the team found that there were both significant heating loads in the winter and cooling loads in the summer. In both cases, heat transfer through the windows was a very large factor. The baseline design assumed a 75% window-to-wall ratio.
 |
Cooling Loads Solar heat gain through the windows is a large driver for cooling loads in the summer. The solar heat gain coefficient and amount of glazing will be important to look at. |
 |
Heating Loads Conductive heat loss through the windows is a large driver for heating loads in the winter. The U-factor and amount of glazing will be important to look at. |
The students chose the “11.3 EER Packaged VAV, 84.4% Boiler Heating” system available in Autodesk Vasari. With this system, meeting these thermal loads led to the fuel and energy use in the charts below.
 |
Fuel use in the winter is driven by the heating system. |
 |
Electricity use is high throughout the summer, as a result of the heat pump used for cooling and the base load of lighting and equipment. |
Iteration 2: Improve Aesthetics
 |
| Iteration 2 |
In the second iteration, the team separated the mass into two independent towers. This maintained the same overall floor area, but made the building more iconic.
Also, the team shifted the orientation 25 degrees clockwise in an attempt to reduce solar gains in the summer: when cooling is needed and solar gain through windows are a significant portion of cooling loads. This changed the peak solar loads in mid-July as follows:
- West: 0.4 kW/m2 to 0.3k W/m2
- East: 0.35 kW/m2 to 0.25 kW/m2
- South: 0.38 kW/m2 to 0.25 kW/m2
- Roof: 0.5 kW/m2 to 0.6 kW/m2 (which may improve solar potential on one of the sloped roofs, but studying cumulative yearly incident solar radiation would be a better metric)
Unfortunately, the net result of these changes this increased the EUI to 151 kWh/m2/year, an increase of 8%. This increase is likely due to the increased surface area to volume ratio in this extreme climate.
 |
 |
|
Solar Radiation study of Iteration 1 vs. Iteration 2: Looking to reduce peak solar loads in the summer on the building facades. |
|
Iteration 3: Reduce Energy Use Intensity by 25%
 |
| Iteration Three |
In the third iteration, the team tried to reduce energy use by 25%. They did this in two ways: 1) optimizing constructions; and 2) connecting the masses to reduce surface to volume ratio.
The glazing was a particularly important aspect of the construction to improve. To improve energy efficiency, they both reduced the window-to-wall ratio and changed the glazing type. They also selected a conceptual construction with higher insulation.
|
Iteration 2
|
Iteration 3
|
|
Cooling Loads – Iteration 2 |
Cooling Loads – Iteration 3 |
|
Heating Loads – Iteration 2 |
Heating Loads – Iteration 3 |
| The team chose to change the constructions as indicated above. In iteration 3, the cooling loads decreased significantly because of the reflective coating on the glazing and reduced glazing percentage. However, heating loads increased. Despite the smaller glazing percentage, the double pane windows used in iteration 3 are significantly less insulating (higher U-factor) than the triple-pane, low-e windows used in iteration 2. The net effect is a reduction of thermal loads and energy use. Note that the scale for the graphs vary between iterations. | |
The EUI of the revised design was 110 kWh/m2/yr, a 27% improvement over iteration two or a 21% improvement over their initial baseline.
Iteration 4: Improve Aesthetics, Again
 |
| Iteration Four |
In the final iteration, they sought to add some final design details that would make the building both higher performing and more aesthetically pleasing.
The team used the built-in “wind tunnel” tool in Autodesk Vasari to simulate exterior airflow around their building form. They sculpted their final design to be a more curvilinear mass, with an intent to allow the strong winds in Astana to flow more smoothly around the building.
Note that all of the iterations used the “11.3 EER Packaged VAV, 84.4% Boiler Heating” system available in Autodesk Vasari.
Final Design & Communication
The final renderings of the design are shown above.
Note that the final renderings seem to depict a window to wall ratio that is larger than what was simulated in the fourth iteration, a potential issue.
The team’s design boards illustrate their process well. Their visuals are very clear, it is well laid out, and there are interpretive captions underneath all of the images and graphs.
Two boards are shown below: a larger one in Russian, and a subset of that in English. Both are also available for download in full resolution.
RUSSIAN:

ENGLISH:

| Attachment | Size |
|---|---|
| 47.21 MB | |
| 25.37 MB | |
| 1.46 MB | |
| 1.49 MB |


