You are here
Climate is the most important environmental factor and the first one that architects and engineers should consider when designing a building. To achieve a net-zero energy building, the design must consider the building’s specific site climate.
The climate can dictate what passive design strategies are most suitable and effective for the building site. For example, strategies that are perfect for a hot dry location may be counterproductive in a cold humid climate.
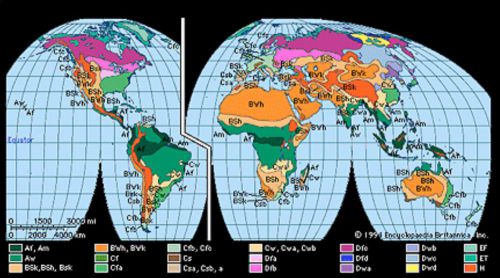 Different climate zones around the world Different climate zones around the world |
A site’s climate is dictated by its latitude, altitude, and terrain. A site located at 60°N on a mountain top will require very different design strategies from a site at 7°S at sea level. Climate influences many aspects of building design such as what the indoor temperature should be, what are the factors defining human thermal comfort, and predicting energy loads for the building.
A common misconception is that climate and weather are interchangeable terms to describe the same thing. This is not true. Climate refers to the average atmospheric conditions over a long period of time, whereas weather refers to the daily temperatures and atmospheric conditions. For example, climate change refers to the changing daily weather patterns over a long period of time.
Climate Classification
Designers can choose passive design strategies suited for their building based on the climate type. Specific classifications of climates vary; however, they can all be useful in determining appropriate design strategies. For instance, the Köppen-Geiger climate classification system is internationally used; however, the US Department of Energy has a guide to US climate zones, and the state of California has its own specific guide to California climate zones.
Climate classification systems are useful in determining overall passive design strategies to implement; however, they often do not consider microclimates. Microclimates are small areas that feature different climate characteristics from the overall climate zone they are located within. They are caused by different topographies, bodies of water, vegetation, and site surroundings. For example, San Francisco is famous for its microclimates. It can be very sunny and feel warm in some neighborhoods, while it’s foggy and cold less than a mile away. This is caused by that city’s famously hilly topography, among other factors. Also see Building Site Surroundings.
Dive Deeper
Temperature
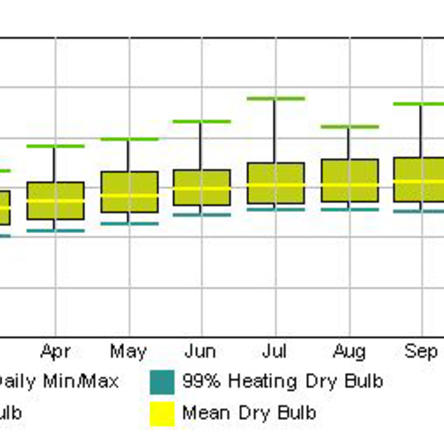
Temperature varies throughout the day and throughout the year and is the most obvious metric to consider for passive heating and cooling design.Reading Temperature Charts
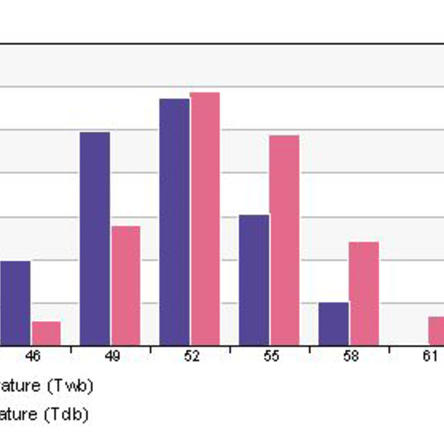
Temperature data can be visualized in a variety of ways. Use the information here to learn about the basic temperature charts you'll come acroos in Revit and some tips for getting the most out of them.Humidity
Humidity can be just as important as temperature for human comfort. Learn how to use humidity metrics to inform your design.Solar Position
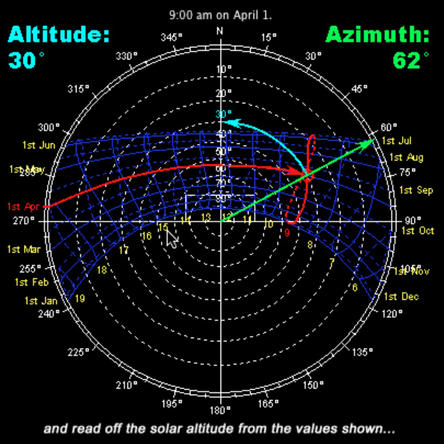
The sun is the primary source of heat and light. When designing for it, you need to account for how it moves through the day and through the year, and when it is obscured by clouds.Reading Sun Path Diagrams
Sun path diagrams can tell you a lot about how the sun will impact your site and building throughout the year. Stereographic sun path diagrams can be used to read the solar azimuth and altitude for a given location.Sky Conditions & Precipitation
As the sun moves, it can encounter sky conditions that can intensify it or obscure it. It is important to understand these metrics and account for them when designing high performance buildings.Solar Radiation Metrics
Solar radiation analysis is useful for passive heating, daylighting, and PV energy generation. It’s important to know what these radiation values represent before you can effectively use them.Wind
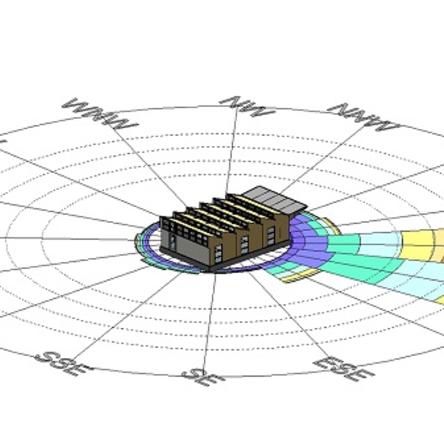
Wind provides natural ventilation and usually cools buildings and people because it accelerates the rate of heat transfer. Wind speed and direction change throughout the day and year, and are not as universally predictable.Wind Rose Diagrams
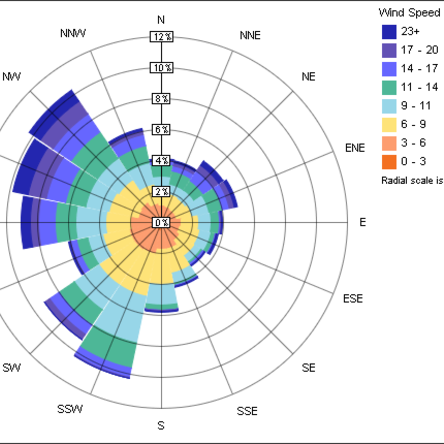
Wind rose diagrams are helpful for interpreting wind speed, frequency, and directionality. Use them to better inform your design decisions, but be aware of unique microclimates and site considerations that wind rose diagrams will not capture.Links and References
- Information from tables in ANSI/ASHRAE/IESNA Standard 90.1-2007
- Global data, world maps and computer animations of the Köppen-Geiger climate classification
- This guide from the US Department of Energy describes the climate zone designations used by Building America and compares them with the climate zone designations used in the International Energy Conservation Code (IECC).
- This document of climate data was made for designers to inform energy-conscious design decisions. Climate Zones are summarized, and suggestions are given for passive design strategies appropriate to each climate.

