Solar radiation is an important consideration in any building that strives for energy efficiency. Solar radiation equates to heat if it is allowed into a building or electricity if it is captured by a PV array.
Understanding the significance of solar radiation will help you to mass, orient and program your building to capitalize on the solar radiation characteristics of your site and climate. Knowing the metrics for solar radiation can help with your analysis.
The intensity of the sun varies by the clarity of the atmosphere and the angle at which the sun strikes a surface, called the "incident angle." The more perpendicular the sun's rays are to a surface, the more heat and light energy.
Incident Solar Radiation
Incident solar radiation is the amount of solar radiation energy received on a given surface during a given time. Values are given in units of energy per area (W/m2or BTU/hr/ft2) and are usually the single most valuable metric for early design studies. This is also sometimes called insolation (Incident Solar radiation) and is sometimes quoted in terms of energy accumulated per day or per year (kWh/m2/day or kWh/m2/yr).
 |
|
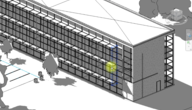
Incident solar radiation, visualized in Autodesk Revit |
Incident solar radiation values are based on two primary components:
- Direct radiation from the sun (direct beam radiation = Ib) which is always measured perpendicular to the sun’s rays
- Diffuse radiation that is both scattered by the clouds and atmosphere (diffuse sky radiation = Id) and the ground in front of the surface (Ir). This is always measured on a horizontal surface.
Sky conditions affect the intensity and distribution of solar radiation. A cloudy sky reduces the amount of direct beam radiation and increases the amount of diffuse sky radiation. For example a clear sky will allow for direct light to travel from the sun directly to your site/building, whereas a cloudy sky will filter the sunlight and scatter diffuse light around your location.
From the total energy of the sun, up to one third can be lost (reflected into space), about 20% reaches the surface as diffuse radiation, and the rest reaches the surface as direct radiation (source).
In addition to sunlight directly heating buildings, solar radiation also creates hotter weather and affects humidity. This is one reason it’s included in diurnal weather charts.
 |
|
Diurnal weather average charts show both direct and diffuse solar radiation. When direct solar radiation varies a lot over the course of a year, it’s cloudy. You can see that Copenhagen is cloudy in the winter because the absolute value of direct radiation is much lower, and the proportion of diffuse to direct radiation is higher. |
Absorbed, Transmitted, and Reflected Radiation
While incident solar radiation is just the amount of energy striking a given surface. It does not necessarily tell you how much radiation is being absorbed into the façade of the building, transmitted through a building’s windows, or reflected back. That depends on the material properties and is governed by the following equation:
100% incident – reflected = Absorbed + Transmitted
Analyzing Solar Radiation
Data for direct and diffuse solar radiation are included in the weather files that analysis software uses.
The incident solar radiation values actually calculated and visualized within Revit are based on your specific building geometry. They take the hourly direct and diffuse radiation data from your weather data, your building geometry, and the time period of the analysis into account. The results of the analysis are always over a given time period (often a single hour) and are presented in Wh/m2(or BTU/ft2). You can multiply by 317.15 to convert from kWh/m2to BTU/ft2.
The calculation used by the software includes shading from surrounding objects (Fshading), the portion of the sky “visible” by the surface (Fsky), and the angle of incidence between the sun and the face being analyzed (theta). Since incident solar radiation is just a measure of the amount of sun hitting a surface, it does not depend on material properties.
 |
|
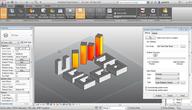
The amount of sky visible by a surface (Fsky) is determined by a shading mask placed over the sky dome (see more info) |
The basic equation1behind the values given in the software is below:
Incident solar radiation = (Ib* Fshading* cos(theta)) + (Id* Fsky)+ Ir
Where:
Ib= direct beam radiation, measured perpendicular to the sun
Id= diffuse sky radiation, measured on horizontal plane
Ir= radiation reflected from the ground
Fshading= shading factor (1 if a point is not shaded, 0 if a point is shaded, a percentage if measured on a surface
Fsky= Visible sky factor (a percentage based on the shading mask)
Theta = angle of incidence between the sun and the face being analyzed
For more information, see:
Using Revit, you cannot calculate absorbed, transmitted, and reflected radiation values directly. However, based on the incident solar radiation values you can use design judgment and manual calculations to help you design features like apertures, shading, and thermal mass.
Time Periods for Solar Radiation Studies
You can choose different units for the simulation settings of solar radiation analysis. These different units have strengths and weaknesses based on the analysis you’re doing.
Peak
-
WHAT: The maximum value calculated during the study period.
-
WHEN: Often want to do this over a given day, month, or season to hone-in on the strongest sun.
- WHY: This metric is primarily used for sizing systems and HVAC equipment, and trying to avoid extremes. Solar load is one of the primary components of cooling loads.
- Cooling and Peak Solar Loads: What is the most solar gain you’ll experience on the hottest day in the summer? Can your building handle these peak solar loads? Can you reduce these gains with shading devices? As you reduce the peak cooling load, can you then reduce the HVAC system size?
- PV Panels: Finding the maximum amount of energy that you can expect to fall on the face of PV panel can help size PV inverters. However, a rule of thumb is that the peak is about 1000 W/m2 for most of the world – so this is often not done in practice.
Average
- WHAT: The hourly average of values over the defined study period. This average is based only on times when the sun is shining. Night time values are not included, even if you specify night time hours.
- WHEN: Determine average overall design conditions for a given month or season. Often calculated only during the building’s operating hours.
- WHY: This metric is primarily used for estimating energy use and gains over a defined time period. (Average radiation energy * total hours = total energy).
- Heating and Average Solar Loads: Estimate passive solar heating potential by studying the average solar radiation during times of low temperatures (when heating is needed).
- PV Panels and Passive Solar Heating: Find the total power available by multiplying the average solar radiation by total hours. Then multiply this value by an assumed system efficiency to get the total expected power output (for electricity generation, or heating).
Cumulative
- WHAT: The total of all values calculated over a given time period.
- WHEN: For whatever time period you’re interested in, you can determine total energy generation or savings. This method can be more accurate than using averages when studying specific time periods.
- WHY: Use when looking for the total energy that will be available over a given time period.
- Passive Heating and Cooling: Learn the heating/cooling load impact over a given time period and how much total energy will I have to manage. For example, what’s the total energy you can harvest for direct-gain system like a thermal mass wall?
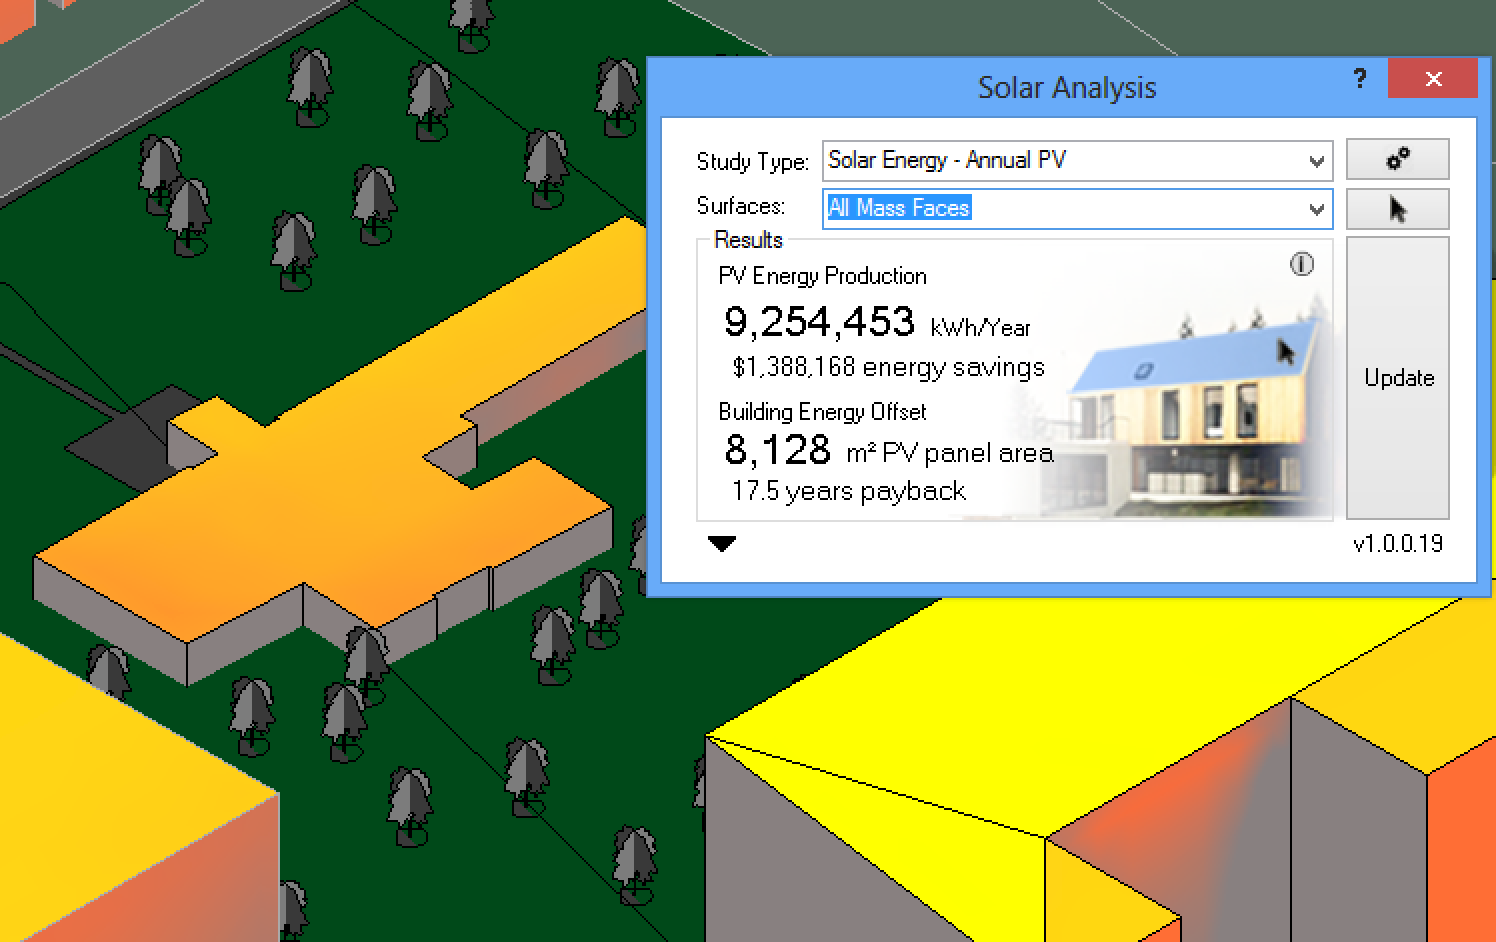
- PV Potential: This is the primary application for cumulative metrics. What is the total energy that will fall on the face of a PV panel that will fall on a panel over a full year and over specific time periods. Can you match building loads with this production potential?
Reference material can be provided for different locations based on cumulative radiation over the course of a day. The chart below can help give a sense of scale for the amount of cumulative solar radiation to expect over the course of a day for different conditions. See table below for to give you a sense of scale for radiation on different faces of a building near and far from the equator.
| Location and Time | Incident Solar Radiation (BTU/ft2/day) | ||||
| City | Month | Horizontal | South Face | North Face | |
| Far from equator | Anchorage, AK | January | 70-110 | 310 | 38 |
| July | 1160-1700 | 990 | 550 | ||
| Near equator | Miami, FL | January | 990-1270 | 1320 | 300 |
| July | 1500-2100 | 550 | 610 | ||
Cumulative incident solar radiation at a location both close to and far from the equator, for both summer and winter. SOURCE: NREL (1and2)
A moment in time
Looking at the solar radiation at a specific time2is most valuable when you’re getting an initial understanding of the available energy on your site.
Using the sun path tool in conjunction with solar radiation results can be a very effective way to understand both the sun’s path and the resulting solar energy striking a face of the building. Note that when studying real-time radiation, the results are the same if you select Peak, Average, or cumulative.
As a reference point, the average incident solar radiation across the entire earth is about 240 W/m².
----------------------
1The actual solar radiation algorithm computed by the software is based on the anisotropic diffuse radiation model developed by Richard Perez, which is a statistical regression formula that takes direct and diffuse radiation into account.
2When analyzing a specific time (i.e. 10am on January 21st), the value that’s presented is actually the incident radiation over the course of an hour starting at that time (Wh/m2). It is not truly instantaneous. However, the radiation intensity and sun position doesn’t change that much over the course of an hour. Also, the ‘h’ unit cancels out, as it Wh/m2/(1 h), which is just W/m2.