Defining the Problem
Visual comfort strives to avoid harmful situations such as glare, and can be defined as the degree of visual satisfaction provided by a particular environment.
There are several studies, but no industry-wide consensus, about how to determine and calculate
glare. For the sake of simplicity and clarity, this study adopted a rule of thumb that areas of brightness more than 10 times brighter than an adjacent area, within the field of view, can cause glare.
This study took place after the design was already built, and was used to validate the design and address problem areas. A variation on this type of analysis can be used to improve designs to reduce glare during the design process.
The Design
Based on the characteristics of the light coming through each window in the living-dining room, Texas A&M’s house has three different window types:.
1. Uniform luminance distribution (daylighting window). Only the sky is visible in this window. It is placed high on the wall and is narrow with a horizontal aspect ratio. The sun’s path is never in the field of view. It is shown as Window 2 (Fig. 3), faces south, and has an area of 9 ft2.
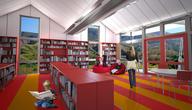
2. Non-uniform luminance distribution (view window). Both the sky and the ground plane are visible through this window. It is shown as Window 4 (Fig. 4), faces west, and has an area of 63 ft2 with a landscape view.
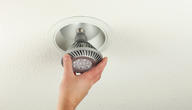
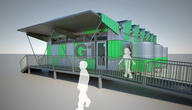
3. PV Panel Window (daylighting window). This window has embedded PV panels to capture energy and block direct sun. It is shown as Window 3 (Fig. 5), faces south, and is 6 ft2.
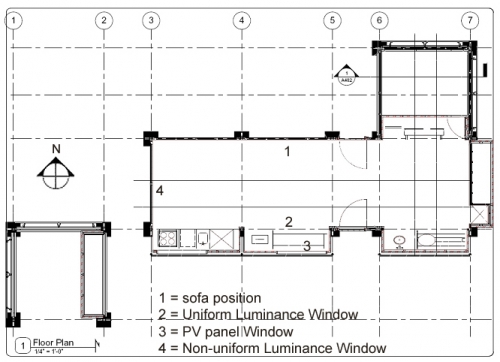
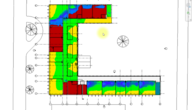
Figure 2: Plan view.
It was initially suspected that Window 4 was a potential source for glare. To test this claim, the visual comfort was evaluated using photometric equipment and computer simulations.
Figure 3: Window 2 showing a uniform luminance distribution.
Figure 4: Window 4 showing a non-uniform luminance distribution.
Figure 5: Window 3 with PV panels.
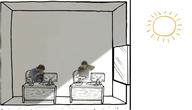
Figure 6: View capturing 3 window types. Photo by Prakash Patel.
Measuring Luminance & Calculating Reflectance
The first step in determining the glare potential of Window 4 was to calculate the reflectance values of all the different materials in the house as well as the materials of the surrounding elements. These values can then be entered into simulation software like
Ecotect and Radiance.
You can determine
reflectance of a material by measuring
luminance values.
Luminance is how much light your eye (or a sensor) sees after it’s reflected off of a surface.
The reflectance value was determined by using a luminance spot meter to measure the luminance of a given surface compared with the luminance of known reference samples (Kodak’s white and grey cards). When taking measurements, the luminous conditions should be as diffuse as possible: no artificial lighting, no daylight at low/high incidence, etc.
Using the following formulas, the hemispherical-hemispherical reflectance (ρhh) was calculated for each of the materials in and around the house.
ρ1 = ρwhite * (L surface / L white)
ρ2 = ρgrey * (L surface / L grey)
ρhh = ρ1 + ρ2 /2
With the luminance spot meter targeting the surface to be measured, the surface reflectance value was measured (L surface). That value is then compared with the same reading taken off the white card located in the same spot (L white). Because we know the reflectance of the card (ρwhite), we can calculate the reflectance of the material (ρ1).
We repeat the procedure using the grey card, and then calculate the average. The RGB values of each surface were also calculated approximately using Photoshop and pictures from the interior of the room.
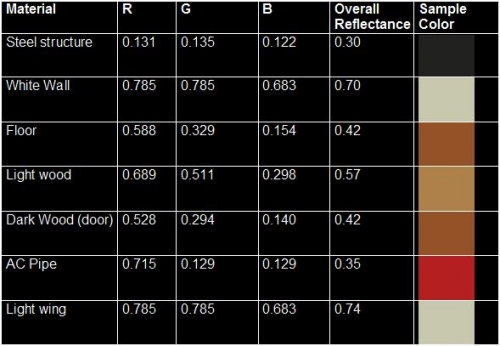
Figure 7: Reflectance value of the materials. The Overall Reflectance is the value measured and calculated.
Measuring the Transmittance of the Windows
You can determine
transmittance of a window by measuring
illuminance values.
Illuminance is how much light is coming from a light source.
To calculate the hemispherical-hemispherical transmittance (Thh) of the windows, the ratio of illuminance of the light after passing through the glazing (lin) is compared with light that bypasses the glazing (lout), where Thh = lin/lout. This measurement needs to be performed under overcast sky conditions.
Two luminance meters were used to take measurements inside the room, with the window partially open so it was easy to measure the light that had and had not passed through the glazing. In order to ensure accuracy, the luminance meters were both calibrated and of the same brand and model. The measurements were stopped at the same time and read simultaneously since the sky can vary its luminance every second. Careful attention was paid not to cast any shadows over the luminance meters.
Creating a Model with the Physical Properties Represented
The house was then modeled in
Ecotect, translating all the information captured on-site into the model to make it as accurate as possible, including the furniture and the climatic conditions. Within the model, camera views we set-up in the same position as on site. With the Radiance Control Panel, the material surfaces were edited with the correct reflectance value, as well as the correct transmittance taken on site.
One challenge encountered was entering the reflectance value of specular objects, such as the polished chrome metal refrigerator, into the 3D model. Radiance cannot accurately represent specular materials that behave like mirrors, since the reflectance will depend on the object being reflecting in the surface.

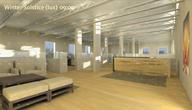
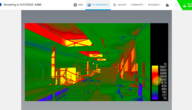
Figure 8: View of the model and some images captured at different sun settings.
Comparing the Physical with the Digital
After creating all the Radiance images (False Color, Human Sensitivity, Fish-eye Lens, Regular Lens), luminance values at specific points can be reported by clicking with the mouse on parts of the computer generated picture. 1
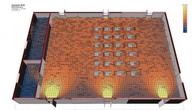
Figure 9: False color image, December 21st at 12:00.
A best-practice is to capture images from specific dates and times, such as the winter and summer solstice and the equinox. The times chosen were 09:00 AM, 12:00 PM, and 04:00 PM for December 21st, March/September 21st, and June 21st.
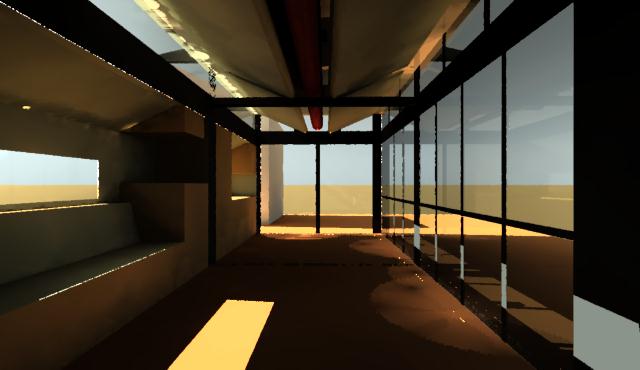
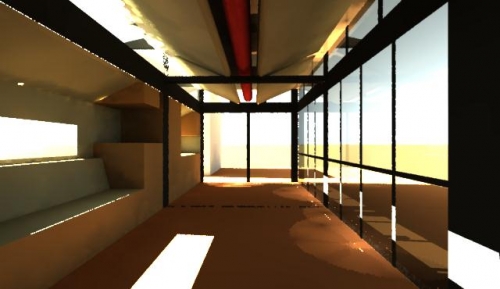 Figure 10: Normal view, December 21st at 12:00.
Figure 11: Human sensitivity view, December 21st at 12:00.
Results
The results from the simulation confirmed that Window 4 was creating glare due to contrast of the relatively dimly lit space compared to looking outside. The glare was caused by the brightness of the window, not direct light striking the interior surfaces.
However, as Figure 9 shows with the red/blue contrast, glare is also occurring as a result of the light coming through Window 3, the PV panel window. This is not as much of a concern because the PV panels within the window that would break-up the direct light, in addition to the trees outside the window, were not modeled.
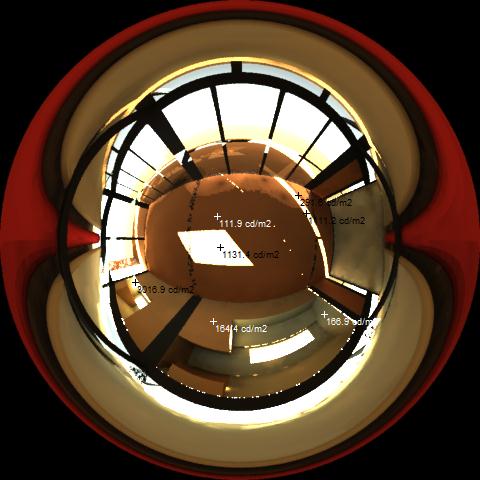
Figure 12: Fish-eye lens looking at the room as a whole from the ceiling, right below the light wings (fabric element that re-directs light). Note the luminance values highlighted with each mouse’s click, and the ratio of directly lighted surfaces against non-directed lighted surfaces (more than 10x).
1 If you take HDR pictures of the space it is important to match the viewpoint from both the simulated and real pictures. Luminance values from the simulation can be compared to the ones found in the HDR picture (or vice-versa), where the ideal situation would be to compare the simulations against HDR pictures and test the reliability of them as a glare detection tool. This study was not completed with the HRD pictures because the house was disassembled before attempting comparison shots could be taken.
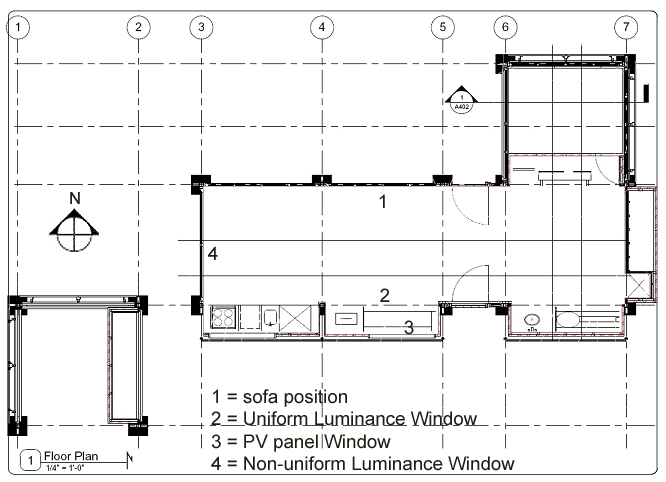
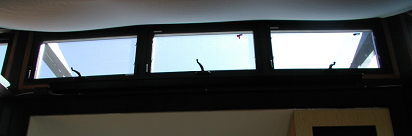
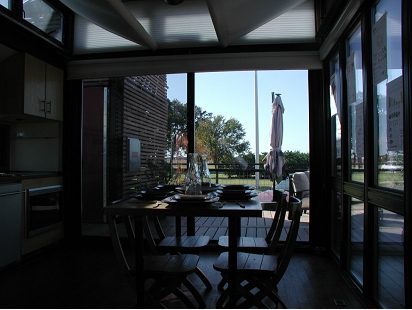
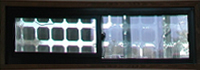
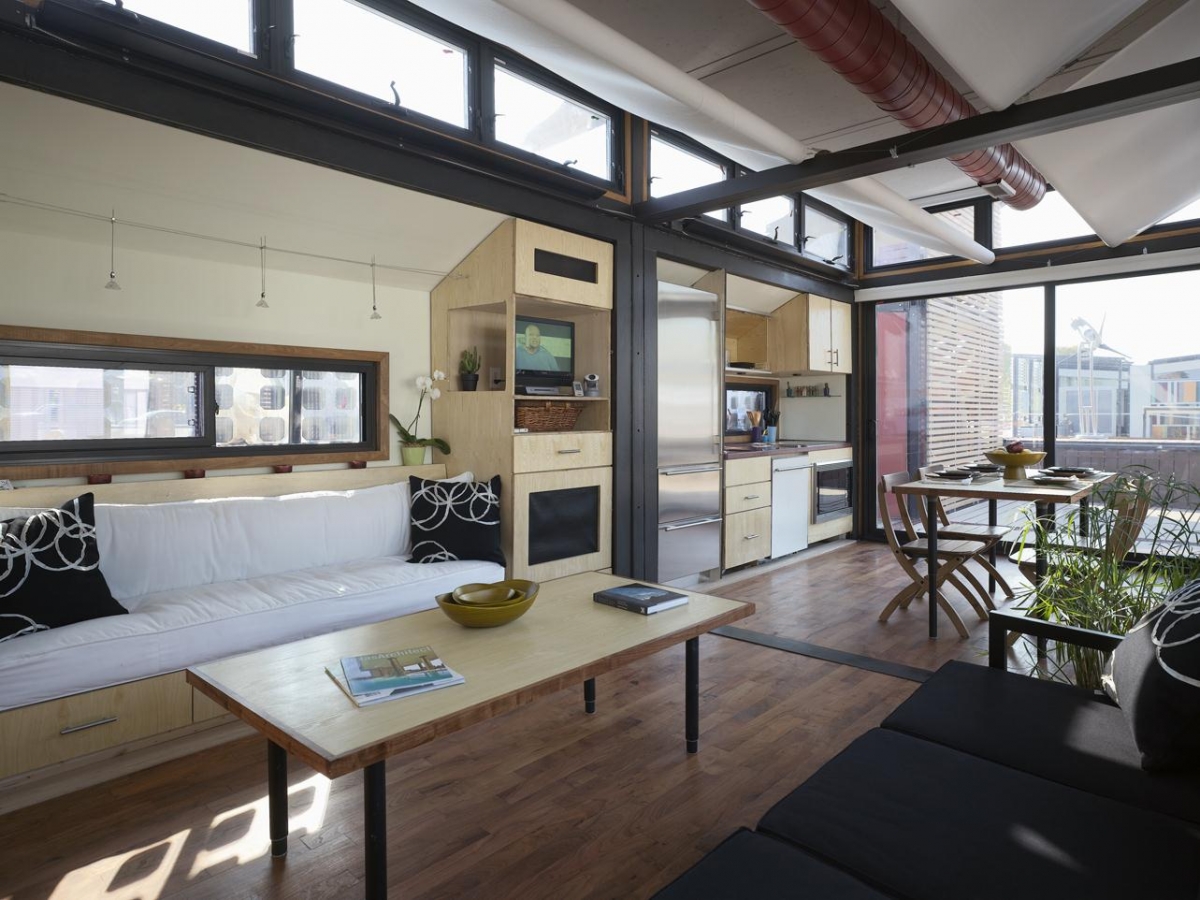

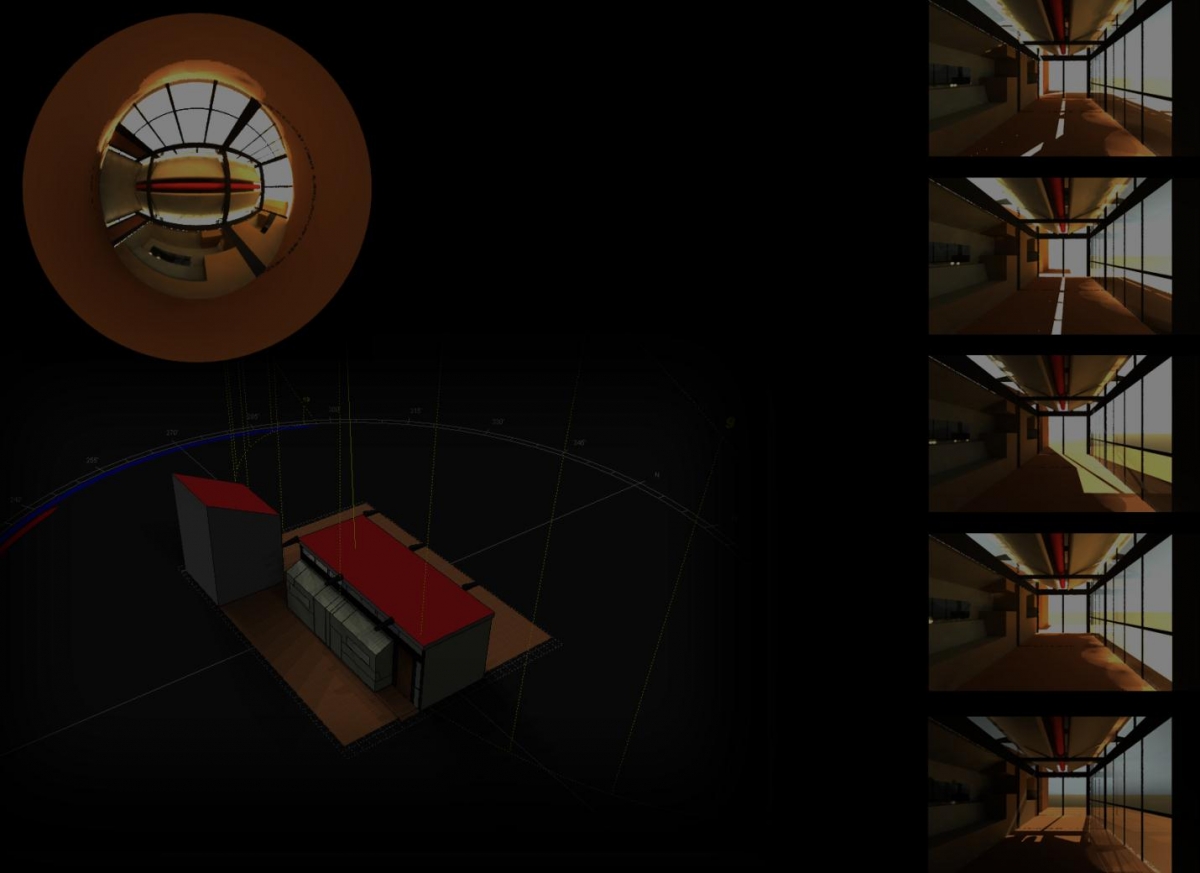
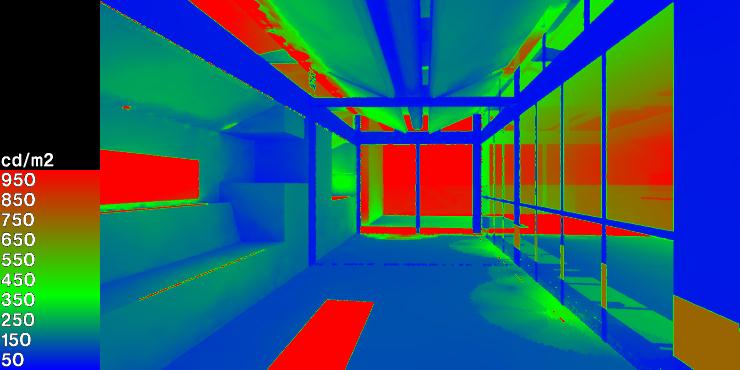
 Figure 10: Normal view, December 21st at 12:00.