You are here
There are many powerful visualization tools in Autodesk Simulation CFD to help you interpret your CFD simulation results, and to make decisions for modifying the design based on the results. These tools allow you to look at different variables in numerous ways to best understand the behavior of the fluid flow.
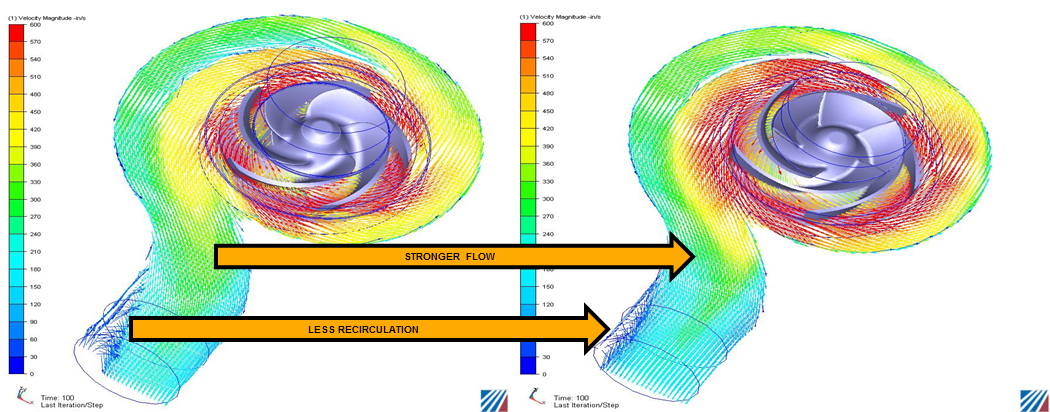
A study of a pump showing the flow field colored by velocity, which can be easily inspected to look for altered flow characteristics
Simulation CFD contains a wide assortment of tools to display your simulation results. These include Results Planes, Particle Traces, Iso Surfaces, and XY Plots. You can plot myriad output quantities including velocity, pressure, and temperature. Additionally, Simulation CFD contains several tools for extracting results at finite points, through two-dimensional cross-sections, on wall surfaces, and on individual parts.
Because solving a single simulation is typically just the first step, Simulation CFD contains a comprehensive set of tools for comparing results from multiple simulations. These tools provide the ability to extract data from specific locations and compare them side by side in a clean, user-friendly environment. You can also compare graphical data from multiple simulations either side-by-side or by flipping between results. However you choose to compare your results, Simulation CFD ensures that you have the information you need to make informed, substantive design decisions.

