You are here
Hidden waste reduced by lightweighting and better material selection

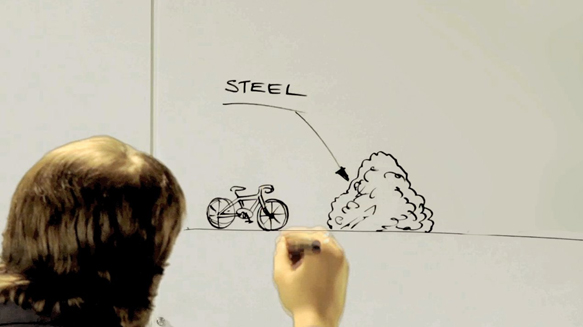
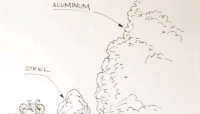
Every pound of material that you save in your product saves much more waste and material upstream. Material Inputs and Ecological Rucksacks are closely related concepts that provide a tangible short-hand for understanding this larger ecological impact of the products and materials around us, and can help understand the importance of lightweighting.

An item’s Material Input (MI) is the total quantity (in kg) of materials moved from nature to create a product or service. For example, you have to dig up and dispose of about seven kilogram of material to make one kilogram of virgin steel. The Ecological Rucksack is the Material Input minus the actual weight of the product, and highlights the hidden material flows.
These figures are based on a life cycle approach from the “cradle” to the point when the product is ready for use. They seek to quantify material inputs derived from raw materials use (including minerals, fuels, and biomass), earth movement, water, and air.
This concept originated with Friedrich Schmidt-Bleek from the Wuppertal Institute for Climate, Environment and Energy in Germany.
Basic Material Input Data:
Industrial products often carry rucksacks that are about 30 times their own weight. So only about 5% of the non-renewable natural material disturbed in the ecosphere actually ends up in a technically useful form. For example, the ecological rucksack of a personal computer is about 200 kg per kg of product (Schmidt-Bleek, Manstein, & Gerhard, June 1999). The table below contains Material Input factors for some common raw materials used in industrial products.
|
Material Input Factors of raw materials |
||
|
Material |
MI (kg/kg) |
|
|
METALS |
Aluminum, virgin |
85 |
|
Aluminum, recycled |
3.5 |
|
|
Copper, virgin |
500 |
|
|
Copper, recycled |
10 |
|
|
Gold |
540,000 |
|
|
Platinum |
500,000 |
|
|
Silver |
7,500 |
|
|
Steel, mild |
7 |
|
|
Steel, stainless |
21 |
|
|
Titanium |
1,000 |
|
|
PLASTICS (range from 5-11) |
High Density Polyethylene (HDPE) |
5.4 |
|
Polypropylene |
3.9 |
|
|
PVC |
8 |
|
|
OTHER |
Aramid Fiber (Kevlar) |
37 |
|
Paper |
15 |
|
|
Plywood |
2 |
|
|
Sand |
1.2 |
|
|
Glass |
2 |
|
|
Cement, Portland |
3.2 |
|
|
Rubber |
5 |
|
SOURCE: Schmidt-Bleek, Manstein, & Gerhard, June 1999
These numbers are not exact and there are many variations based on the source of the material. They should only be used as preliminary average figures to help design generally less resource-intense products. They are based on raw materials use and earth movement (does not include water and air use).
Using Material Input Data:
To calculate the Material Input of your product, multiply the mass of each material you use by its Material Input factor, and then sum these values.
Considering the Material Input per Service Unit (MIPS = MI/ S) is a good way to compare the resource consumption of different solutions that produce the same service. The metric you use for the service unit (S) depends on your product, but could be hours used or distance traveled. To improve the resource productivity of the solution, you can either increase its service lifetime or reduce its material input.
Sources and More Information:
Wuppertal Institute website and their Material Input publications.
Ritthoff, M., Rohn, H., & and Liedtke, C. (2002). Calculating MIPS: Resource Productivity of Products and Services. North Rhine-Westphalia, Germany: Wuppertal Institute for Climate, Environment and Energy.
Schmidt-Bleek, F., Manstein, C., & Gerhard, W. (June 1999). Klagenfurt Innovation - Transnational Report. Klagenfurt, Austria.
(http://www.factor10-institute.org/files/design/Klagenfurt_Innovation.pdf)
Sorensen, J. (2005). Ecological Rucksack for materials used in everyday products. Copenhagen: NOAH - Friends of the Earth Denmark.
(http://www.noah.dk/baeredygtig/rucksack/)

