You are here
How Does this Apply to Simulation?
Understanding deformation and modes of failure is a major goal of simulation. A good analysis can help you answer questions like:
- Will your design stand up to the loads it will experience in everyday use?
- What about a worst case scenario?
- Can you reduce the weight and amount of material your design uses?
To really understand simulation results, you need a solid understanding the following basic metrics that the software considers: force, torque, pressure, stress, etc.
Software simulation is valuable because some of these metrics are often impossible to calculate by hand for even simple mechanical systems.
Force
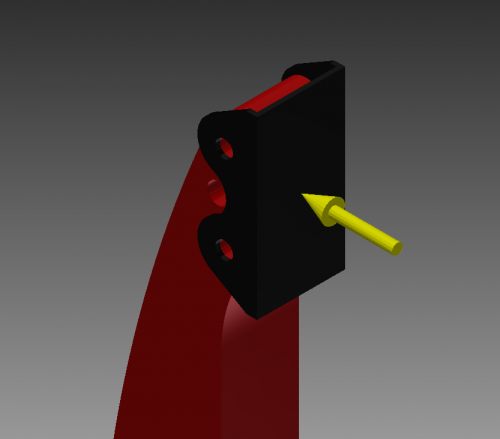
Force is basically the push or pull on any object. This is perhaps the most intuitive of the basic aspects of mechanics. Newton’s second law states that the sum of forces on an object will equal the mass of that object times its acceleration (F=ma). If forces on an object do not sum to zero, the object will accelerate.
Simple force application in FEA
Torque
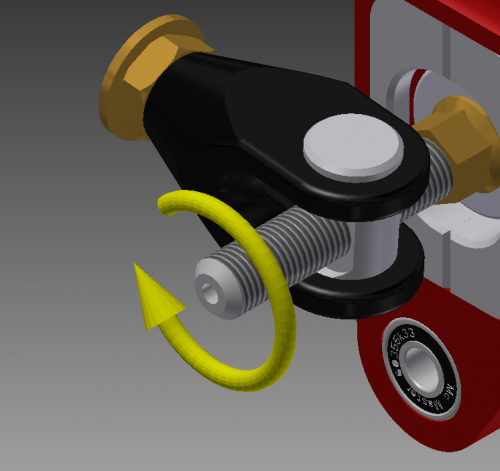
Torque is essentially the amount of “twisting force” on an object at a point. Torque may also be referred to as a “Moment” by engineers.
Torque (represented by the Greek lower case letter tau) is the cross product of radius and force (τ=r x F). This means that torque will multiply linearly as force or radius is increased. Think of trying to unscrew a rusty bolt. It is easier to do this using a longer wrench, since you can apply more torque with the same amount of force.
A simple moment applied in FEA
Pressure
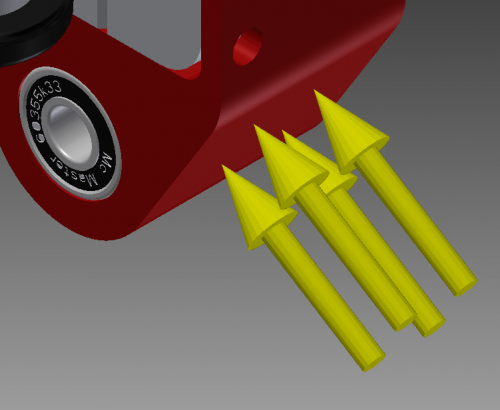
Pressure is simply force applied over an area, or as a formula p=F/A. Pressure is a very important to understanding how materials fail. Remember that pressure is inversely proportional to area. Therefore, a person wearing snowshoes (which increase the area of their footprint) is able to walk on snow, while they would sink if they were wearing regular boots.
A simple pressure applied in FEA
Stress
Stress can be thought of the internal reaction to forces on an object.
This is one of the most important concepts in mechanics of materials, because materials fail as a result of high stresses. When a force is applied to an object that is unable to move (constrained in FEA terms) it must react those forces by deforming.
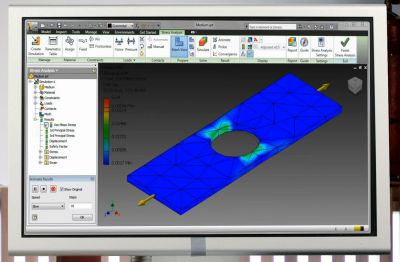
Stresses on an object in FEA
Stress can generally be broken down into 3 types: tensile (pulling) stress, compressive (squeezing) stress, and shear (sliding) stress. Tensile and compressive stress are often grouped and called normal stresses, as they acted perpendicular, or “normal to” a surface. Stress is denoted by the Greek lower case letter sigma (σ). Stress is calculated the same way as pressure, where σ=F/A.
These kinds of stress can be combined mathematically into a single form known as Von Mises stress. If the Von Mises stress exceeds the yield point anywhere in the part then we can expect the material to yield at that location. As the Von Mises yield criterion is the most empirically accurate way to judge yielding for ductile materials it is the standard form used in analyzing part stresses.
Strain and Deformation
Strain is the measure of the deformation (aka displacement) of a material. For an object being pulled in only one direction this equation is given simply as ϵ=ΔL\L. That is, strain is the change in length of the material divided by the original length of the material. It is often given as a decimal. Strain can also be measured as normal strain, or shear strain. These two kinds of strain together can be used to fully define the deformation of an object. The deformation of an object is often a major requirement in engineering applications, for example when two parts must not come into contact under load or when an object must be stiff to retain a particular geometry.
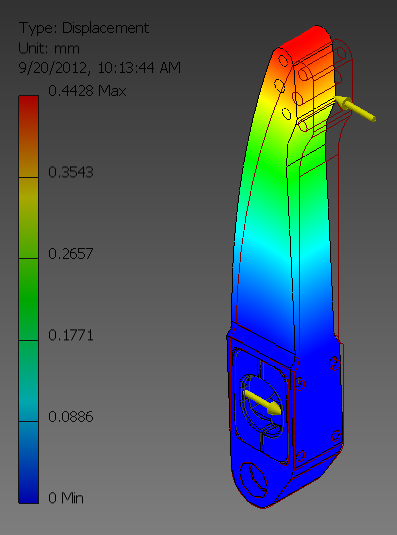
Displacement in FEA
Stress-Strain Curves
Stress-strain curves are in many ways the key to understanding and applying the results of simulation analyses. Stress-strain curves are unique for each material, but many kinds of materials exhibit the same patterns of behavior as loads are increased.
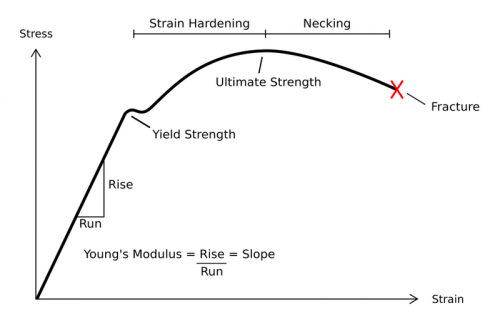
A typical stress-strain curve for steel (wikicommons)
Here we can see a stress-strain curve typical of a common ductile material such as mild steel under tensile loading. At the left side of the graph is the region where the material’s response is known as “linear-elastic.” Under elastic deformation the material will deform, but as the load is removed it will return to its original shape. This can be seen if you lightly flex a long metal rod, which will bounce back when you stop applying force.
How much the material will deform in the linear elastic range is measured by Young’s Modulus, which is measured as stress over strain.
Next, if more force is applied, the material will reach its yield strength. This is known as the yield point, and after this the material will experience “plastic deformation” or permanent deformation. Note that some materials, such as aluminum, have different stress-strain curves in which there is no clear “hump” at the yield strength, and so that number is calculated using a standard equation for when the material is said to have moved into the plastic deformation region.
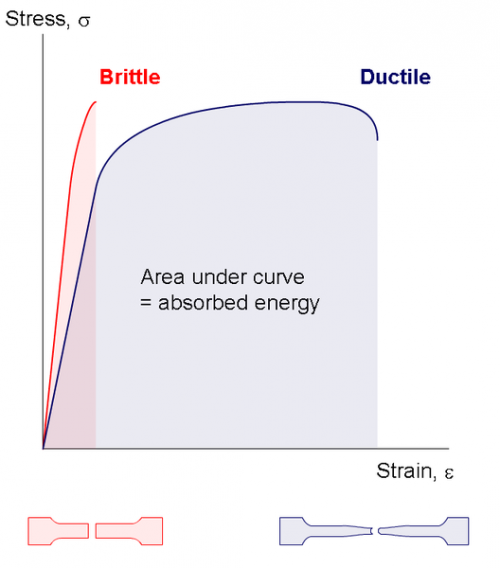
Often, engineering applications want to avoid any permanent deformation, so the yield stress is used as the limiting stress in simulations. However, in certain specialized applications, such as crumple zones in a car, a product may be designed to yield in specific situations. The the amount of energy absorbed by a material is given by the area under the stress-strain curve. These advanced applications are beyond the scope of this explanation. We will also forgo explanations of strain hardening and necking, although these can be found online.
Brittle materials, such as cast iron and glass, exhibit very different stress-strain curves than ductile materials. These materials will fracture before undergoing any appreciable plastic deformation. This can be a very negative behavior in many situations, as these materials will likely not give obvious visual or audible indication before catastrophic failure. Their ultimate tensile strength may also vary widely based on even small variations in manufacture or structure.
The stress-strain curves of brittle vs. ductile materials. Note the increased amount of energy absorbed by ductile materials of similar nature (wikicommons)
Other materials, such as elastomers (which include rubbers) exhibit very unusual stress-strain curves that will not be covered here.
Factor of Safety
The factor of safety of a design is an easy to understand and very important number. It is found by dividing the maximum stress possible in the system (usually the yield strength of the material to prevent permanent deformation) by the maximum expected load.
Factor of Safety=(Material Strength)/(Design Load)
For instance, if a material yields at 10 MPa and the maximum expected stress for a given design is 1 MPa, then the factor of safety is 10. The design would survive stresses up to 10 times the maximum expected stresses.
Different applications will often have different factors of safety. For example, buildings may use a factor of safety of 2 for their structural members, while the factor of safety in aircraft may be lower, often 1.5, which is specified by the FAA. It is important to note that the factors of safety are sufficient, as the maximum expected load is a worst-case scenario load (such as an airplane flying through a hurricane) not standard everyday loads.
A Boeing 787 being tested for wing loading. Note the displacement of the wings. This shows that the loads the plane is designed to handle are much higher than anything you would see in everyday flight.
In the picture above of a flexed airplane wing, you can see how much the wings are flexing at a load just above the maximum operating load. This is a good example of how the loads used to calculate factor of safety are much greater than the average you would expect in everyday use.
When designing your parts, a large factor of safety can be an indication that you could save money and weight by reducing the amount of material used or using a different material. Try to use thinner parts or cutouts to accomplish this.
Learning More
There are many places to learn about the mechanics of materials, but perhaps the best website around is Non Destructive Testing Resource Center.
Understanding these principles, along with other aspects that can affect failure such as corrosion, can help prevent your product being sent to an early grave.

